(Update: John Batchelor show radio interview on this blog post)
The whole tax debate is supremely frustrating to anyone who survived econ 1.
The ill effects of taxation -- the "distortions" -- depend on the total, marginal rate including transfers. If I earn an extra dollar, how much more stuff do I get, or how much more of someone else's services can I receive? That calculation has to include all taxes, federal, payroll, state, local, sales, excise, etc. and phaseouts.
And, if you receive a benefit from the government that phases out with income, so every dollar of income above (say) $30,000 reduces your benefit by 50 cents, then you face a 50 percent marginal tax rate even if you pay no "taxes" at all. Taxes and benefits -- both in level and on the margin -- need to be considered together.
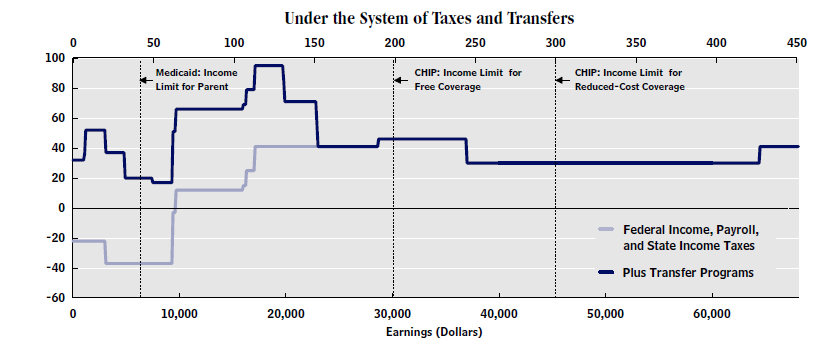
I've been looking for good calculations of marginal rates. The CBO has just issued a nice report titled "Effective Marginal Tax Rates for Low- and Moderate-Income Workers" that begins (begins!) to shed some light on the right question. Here's one important graph, titled "Marginal Tax Rates for a Hypothetical Single Parent with One Child, by Earnings, in 2012";
The CBO's headline (first page) says these low-income workers
face a marginal tax rate of 30 percent, on average, under the provisions of law in effect in 2012. ... Over the next two years, CBO estimates, various provisions of current law will cause marginal tax rates among this population to rise, on average, to 32 percent in 2013 and to 35 percent in 2014.30% and rising to 35% is already news. (A lot of the rise reflects means-tested insurance subsidies under the ACA). But digging a bit deeper I see a more chilling story in the CBO report
...CBO also finds that under provisions of law in effect between 2012 and 2014, marginal tax rates vary greatly across earnings ranges and among individuals within the same earnings range.Consider again the graph on the top. The marginal tax rate is not an even 30%. There are slices of income where the marginal rate approaches 100%. And, the graph is really misleading because it doesn't graph the "cliffs." The figure caption says
The dotted lines indicate income limits for Medicaid and CHIP where taxpayers face “cliffs.” Similar spikes in marginal tax rates when the taxpayer loses eligibility for TANF and SNAP are not illustrated.The CBO's artists apprently did not want to graph the vertical spikes in an honest solid line. (The CBO's "average" is, as far as I can tell, an average across taxpayers. No taxpayer reported income at exactly the cliff income, not one dollar more or less, otherwise the "average" would have been infinite. The CBO is not taking an "average" across income, which would include the cliffs.)
Another figure gets at the situation better, I think, though it takes more sophistication to digest

Now the "cliffs" show up. Overall, disposable income is very flat from $0 to $30,000 of income, and there are swaths where a discrete jump in income produces no increase in overall income.
Cliffs are particularly pernicious incentives. Even if people overlook marginal incentives for a while, "if you take this job you'll lose your health insurance" really focuses the mind.
And, this is only the start. Single parents with one child who are going to work need childcare, transportation, clothes, and so on. The calculation leaves out sales taxes and a range of additional means-tested programs and social services. It only represents marginal tax rates by people who actually do work and file taxes. The jump from out of the labor force, illegal work, or disability to employment is higher. (Box 3 p. 17 cites a 36% marginal tax rate for the jump to employment and 47 percent from part time to full time.)
Even within the same income group, there is a tremendous variation in marginal tax rates.


These estimates are also understatements, as they only scratch the surface. The actual marginal tax + loss of benefit rates people face is very complex. A quick poll of faculty at the Booth lunch table showed the usual range of opinion but no serious calculations. Maybe it's deliberately complex so people will not make the obvious responses to big marginal tax rates!
And, in the name of simplicity, the CBO left out dozens if not hundreds of additional means-tested programs. As the CBO says (p. v) "Including additional programs would generally increase estimates of marginal tax rates." Yes, it would.
Why is there so much variation in tax rate across people of the same income? (p.v) The CBO here is looking at actual taxpayers, and
Survey data show that the majority of lower-income families do not receive means-tested transfers, either because they do not meet additional, nonfinancial eligibility requirements or because they are eligible but do not apply for benefits. Of those who receive transfers, the majority participate in only one program.This is both heartening and chilling. Written into law is a much larger welfare state than we actually have. Americans don't fully play the game. Yet. Witness the recent ad campaign to get more people to use food stamps. Once more people take more full advantage of the programs available to them, first the budget explodes. And second, they start to feel larger and larger marginal tax rates against growing out of the programs.
All of this is official confirmation of the point Casey Mulligan has been making in his new book: Our system imposes huge disincentives for low-income people to move up.
Greg Mankiw (H/T this is where I learned about the report) suggests
What struck me is how close these marginal tax rates are to the marginal tax rates at the top of the income distribution. This means that we could repeal all these taxes and transfer programs, replace them with a flat tax along with a universal lump-sum grant, and achieve approximately the same overall degree of progressivity.The spread in tax rates means Greg is much more right than he knows. A $20,000 "universal lump sum grant" and 30% flat tax rate would indeed be a better system -- not because it would approximate the current system more simply, as Greg implies, but because it would dramatically lower marginal tax rates for so many low-income families.
The idea is worth pursuing. A "lump sum grant" means $20,000 voucher for food, housing, health insurance, and eliminating all the programs and their administering bureacracies. I didn't know Greg was such a radical! However, $20,000 x 100 million households = $2 trillion, on top of the military and all other federal spending. It's not clear a flat 30% even with no deductions at all is going to pay for it.
Perhaps we keep the $20,000 as provided benefits, as they now are, just lousy enough that rich people abandon them voluntarily as they bail out of public schools. That limits the budget impact a bit, though it will be pretty hard to explain to a $50,000 wage earner now paying next to nothing in Federal income taxes that they'll be writing a check for $15,000 next year, but don't feel bad because now they get to use food stamps and be on medicare.
We're going decidedly and inevitably in the other direction, which is the CBO's point in its gentle and understated admonition that the "average" marginal rate is going to rise to 35%.
The response to our budget woes is more means-testing: Leaving deductions in place but capping them, adding to the phaseouts in the tax system, more means-testing for Social Security, Medicare, and Medicaid, all of the low-income subsidies for the ACA which phase out with income of hours on the job.
It all sounds great if you don't understand margins. Why should the government help rich people? But every time we do cap something or means-test it, we introduce another marginal tax. And some of the biggest marginal taxes hit the poor.
This is a deeply important point so let me reiterate it. If you means-test any benefit, you introduce a steep marginal tax rate at means-testing point. If you don't means-test a benefit, you blow out the budget. It's a hard nut, that you can't get around.
This is not a little problem. We worry about the distribution of income in the US, and how low-income people seem stuck. Well, faced with these barriers of course they're stuck. And the barriers are going to get worse.
What to do? To some extent this is why economics is called the dismal science. Draw the line any way you want, subject to the budget constraint that all redistributed money has to come from somewhere. If you make it high at the left end it has to have a low slope. Compassion breeds "dependency," a pejorative word for the simple fact that poor people are smart and respond to incentives.
But we can do a lot better! At least we can measure and talk about total marginal tax rates including phaseouts and benefits -- and the CBO study is only a beginning -- rather than the silly Warren Buffet vs. his Secretary stories about average personal Federal income taxes in isolation.
And, we can avoid the big variation and the cliffs. We can avoid some people facing 100% or more margins and others facing no margin. We can bring everyone closer to the "average" 30% rate. The costs of a high rate are larger than the benefits of a low rate (and varying rates cause people to clump up on the high rates.)
Finally, perhaps more time limit as well as income limit will work as a sensible compromise. Unemployment benefits are limited in time, which is what has kept the US from developing the permanent underclass on the dole of some European countries.
Half-joke: the Republican response to the Democrat's desire to raise the high bracket of Federal income taxes to 39.5%, and raise the taxes on dividends and capital gains should be: Fine. You can have the Warren buffet lower limit. In return, we get the Greg Mankiw upper limit: (named after Greg's 90% marginal tax rate) If any taxpayer can show that his total marginal tax rate, including payroll, Federal, phaseout, state, local, excise, share of corporate, sales, property, and removal of benefits exceeds 75%, then his Federal income tax rate shall be reduced to that level. Well, maybe we should take this seriously on the low end of the income distribution.
Personal story: This is how I became an economist. Taking econ 1 as my humanities distribution requirement at MIT (pause for laugh), the professor showed the budget constraint for people on welfare, which at the time reduced benefits one for one with income, and kicked people out of public housing. For years I had felt at sea in the moral and cultural arguments about welfare dependency. In a flash, I saw it, there but for the grace of good fortune go I.
Next topic. In week 2 of econ 1 you learn that the distributional effects of taxation also are not read off the headline rates of the Federal income tax, but also depend on all taxation, all spending, and the burden of taxation through higher prices and wages, not who actually pays the taxes. That political argument is even sillier.
Update:
An excellent comment arrived by email:
Dear John... Regarding your post on marginal tax rates, the best paper I’ve seen on the subject is by Larry Kotlikoff and David Rapson, “Does it Pay, at the Margin, to Work and Save? Measuring Effective Marginal Taxes on Americans’ Labor and Saving.” This includes state programs (in Massachusetts, if I recall correctly), which add even more phaseouts. (Link to the NBER version). The chart on page 45 of the file is particularly striking. [reproduced below]

[Kotlikoff's abstract is great:
The paper offers four main takeaways. First, thanks to the incredible complexity of the U.S. fiscal system, it's impossible for anyone to understand her incentive to work, save, or contribute to retirement accounts absent highly advanced computer technology and software. Second, the U.S. fiscal system provides most households with very strong reasons to limit their labor supply and saving. Third, the system offers very high-income young and middle aged households as well as most older households tremendous opportunities to arbitrage the tax system by contributing to retirement accounts. Fourth, the patterns by age and income of marginal net tax rates on earnings, marginal net tax rates on saving, and tax-arbitrage opportunities can be summarized with one word -- bizarre.]This anecdote from Jeff Liebman also illustrates the issue in a way that Kotlikoff’s charts might not:
Despite the EITC and child credit, the poverty trap is still very much a reality in the U.S. A woman called me out of the blue last week and told me her self-sufficiency counselor had suggested she get in touch with me. She had moved from a $25,000 a year job to a $35,000 a year job, and suddenly she couldn’t make ends meet any more. I told her I didn’t know what I could do for her, but agreed to meet with her. She showed me all her pay stubs etc. She really did come out behind by several hundred dollars a month. She lost free health insurance and instead had to pay $230 a month for her employer-provided health insurance. Her rent associated with her section 8 voucher went up by 30% of the income gain (which is the rule). She lost the ($280 a month) subsidized child care voucher she had for after-school care for her child. She lost around $1600 a year of the EITC. She paid payroll tax on the additional income. Finally, the new job was in Boston, and she lived in a suburb. So now she has $300 a month of additional gas and parking charges. She asked me if she should go back to earning $25,000.....[Thanks! I also am not a specialist in this literature and am glad for pointers to good work.]
Update 2: Another graph, thanks to MG.
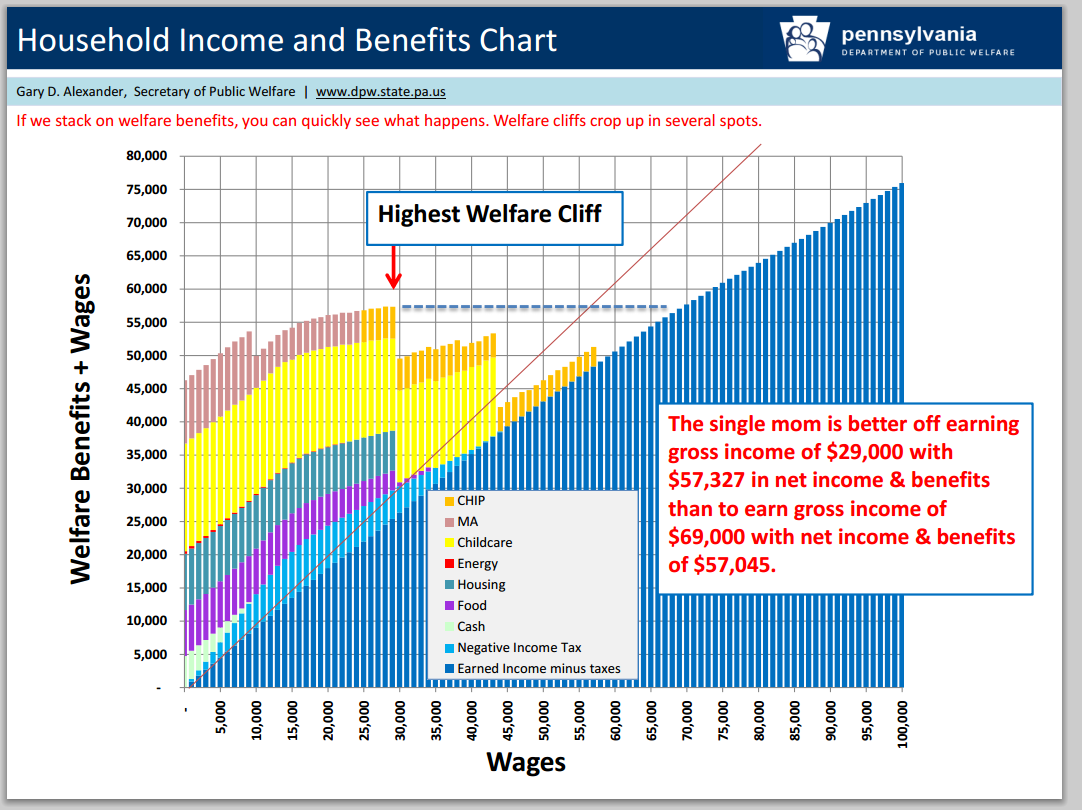
Source, a great presentation by Gary D. AlexanderSecretary of Public Welfare Commonwealth of Pennsylvania at the AEI